

Most organisations think about print costs in terms of pages. Print more pages, costs go up. Print fewer pages, costs come down. On the surface, that logic makes sense. The problem is that not all pages cost the same to print.
Manufacturers calculate toner yields using an industry standard assumption of around 5% page coverage. In simple terms, that means a lightly populated page with a small amount of text. In real office environments, very few documents look like that:
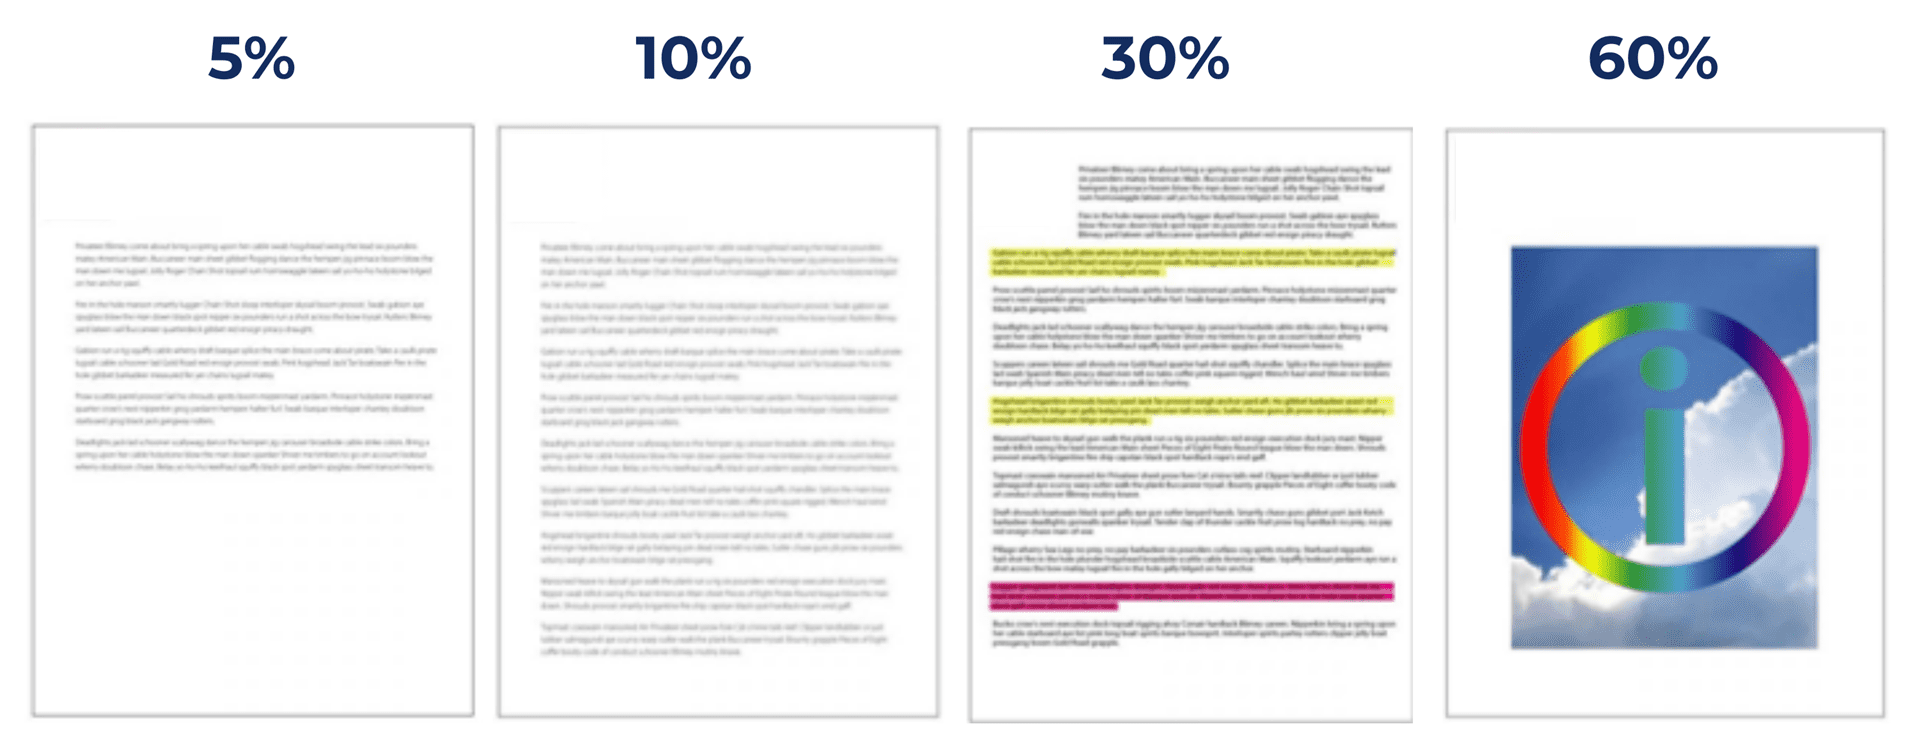
The above is an example of a document with approximately 5% coverage. As soon as documents move beyond this hypothetical and into reality, the actual percentages climb rapidly.
What real-world documents actually look like
Based on averages observed during client print audits, typical document types often fall well above the 5% coverage assumption.
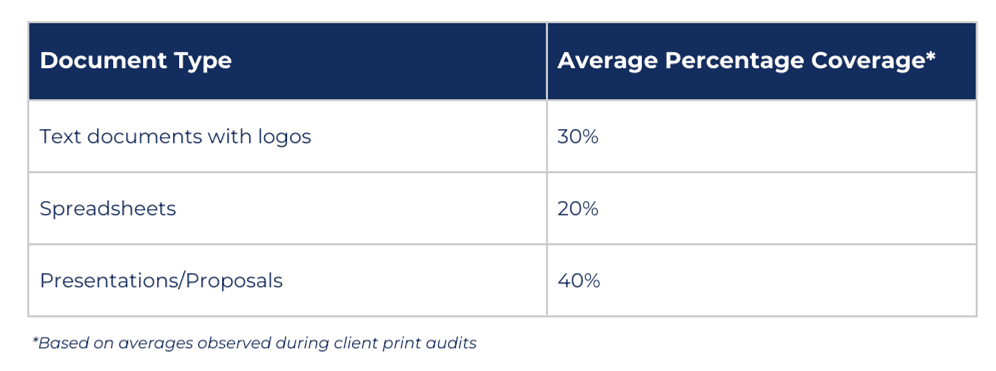
The important point here is not the exact percentages, but the pattern. Everyday documents routinely sit three to five times above the coverage level used to calculate quoted toner yields. This in turn has a direct and often overlooked impact on cost.
How page coverage drives cost per page
As page coverage increases, toner is consumed more quickly. The yields quoted by the manufacturers fall, and the effective cost per page rises sharply. The cartridge price does not change, but the economics and cost burden of printing does. To see how this plays out in practice, consider a very average and commonly used office printer using standard black toner that costs €120 with a manufacturer-quoted page yield of 3,000 at 5% coverage:
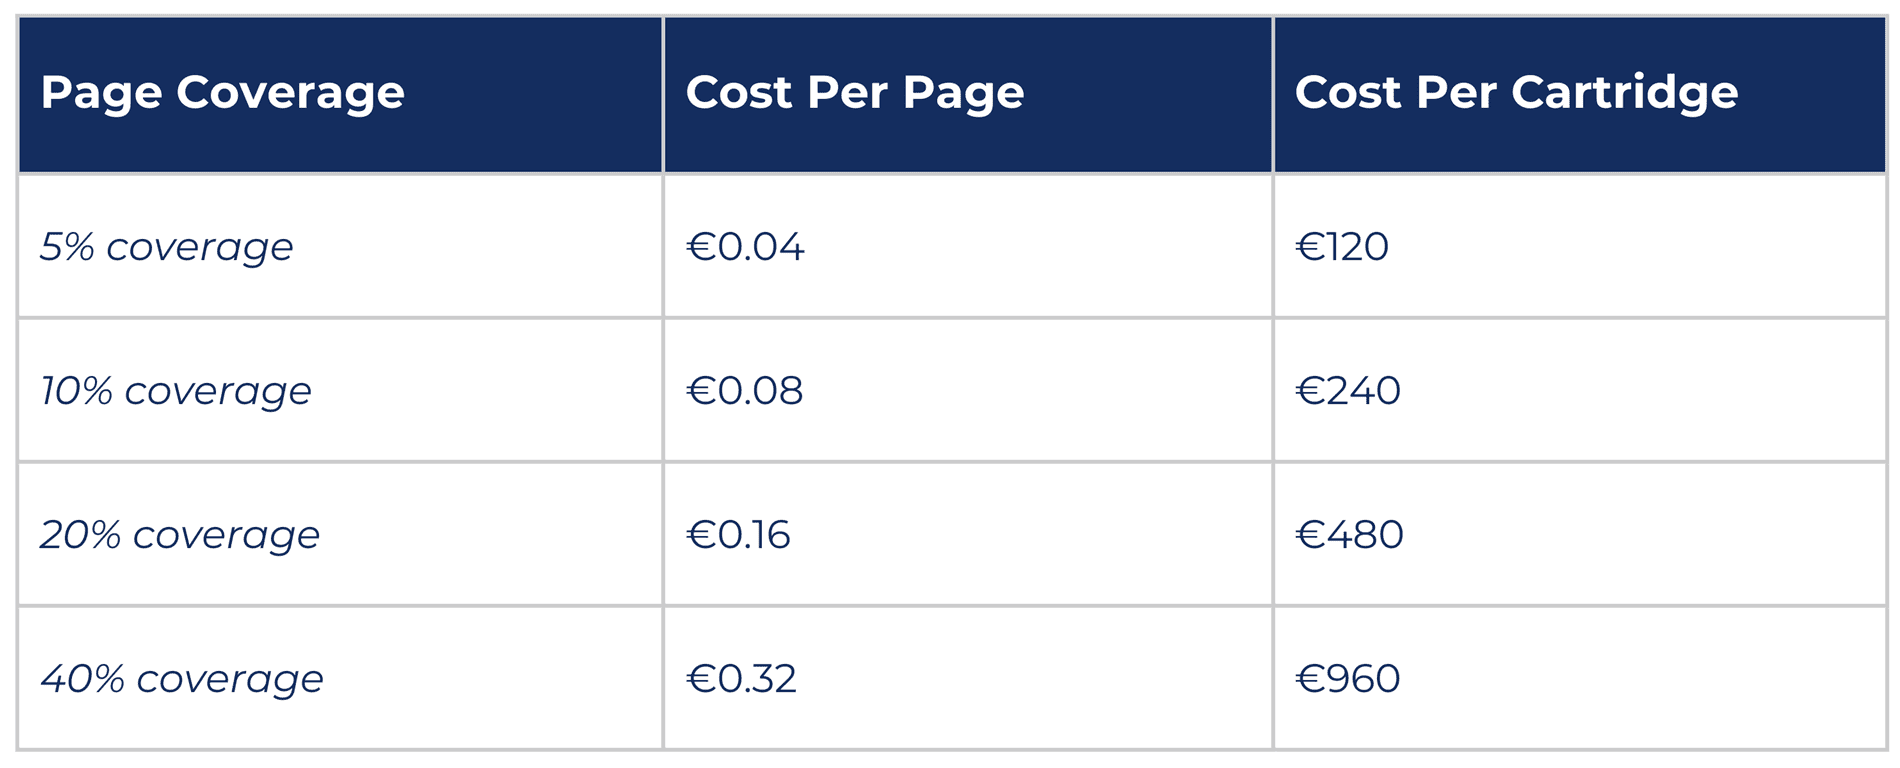
At 5% coverage, print costs appear low, reasonable, and predictable. At 20% coverage, which is far more typical of real-world documents, the cost per page has quadrupled. At higher coverage levels, costs escalate very quickly.
This is why two teams printing the same number of pages can generate very different costs, and why print spend can fluctuate unpredictably even when volumes appear stable.
Why colour printing amplifies the challenge
In most office environments, black toner is only part of the picture. Logos, charts, graphs, and branded templates mean that colour printing is far more common than many organisations realise.
Colour printing compounds the coverage issue because each colour page consumes not just black toner, but cyan, yellow, and magenta as well.
Using a typical set of colour cartridges, each costing €107 with a manufacturer-quote yield of 1,800 pages, the impact of coverage becomes even more pronounced.
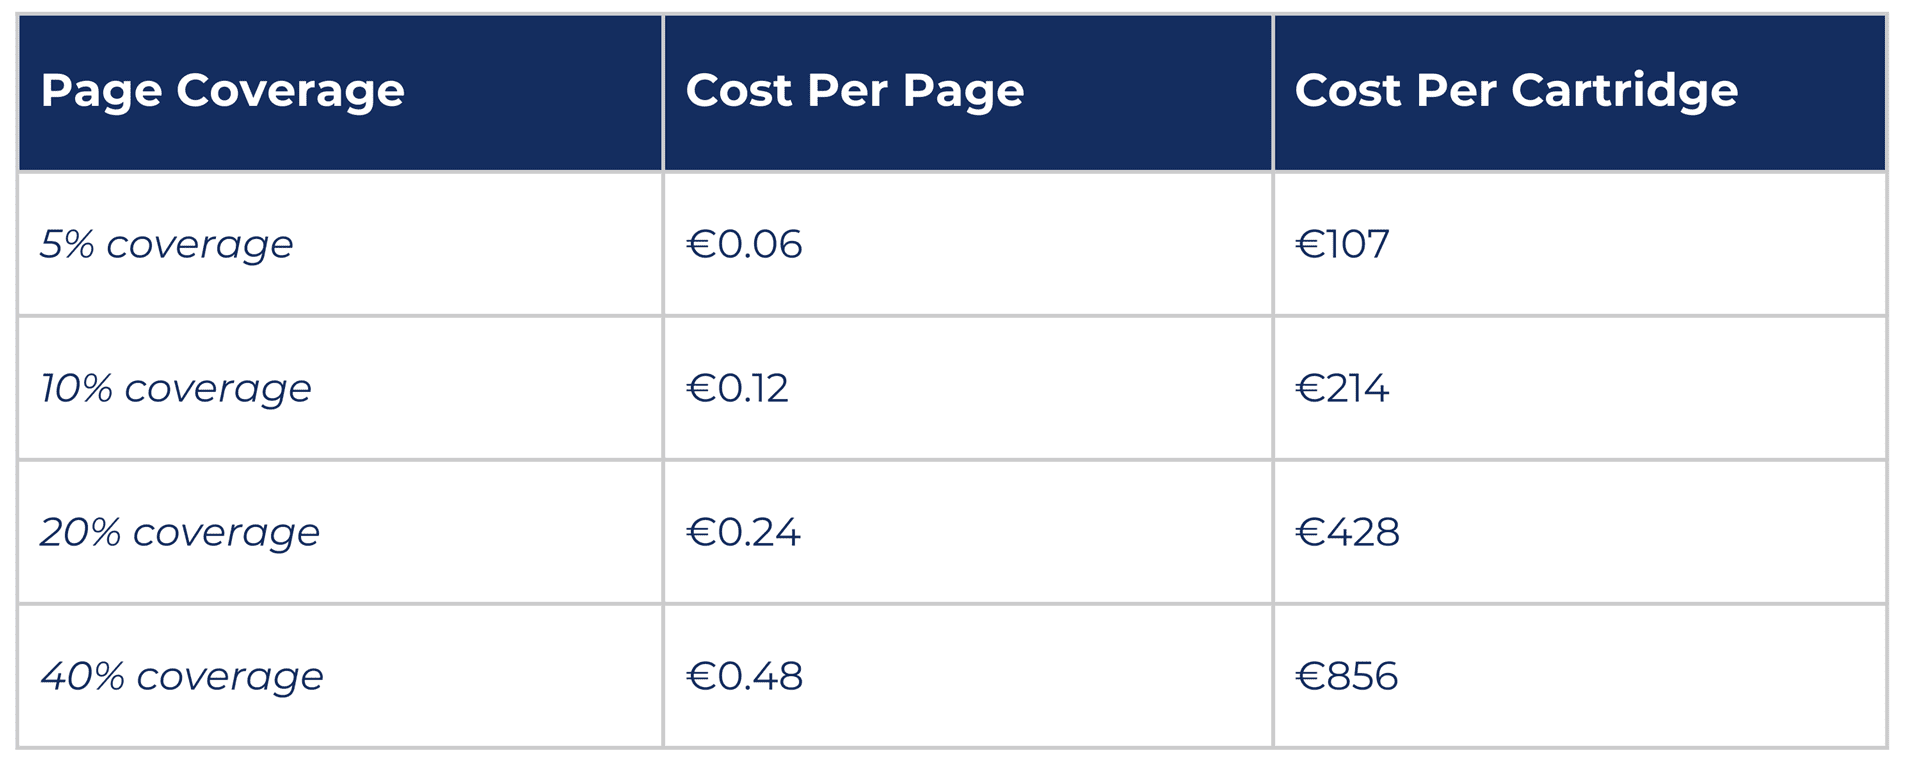
Because colour pages draw on three separate colour cartridges, these costs must be multiplied accordingly. At 20% coverage, the colour component alone accounts for approximately €0.72 per page, before black toner is even considered.
What this means in practical terms
At this point, it helps to step back from the individual figures and look at what this means in a typical office setting. Consider an organisation printing just 300 mixed, colour documents per month. That volume would be considered modest in many environments.
At an average coverage level of around 20%, the cost breakdown looks like this:
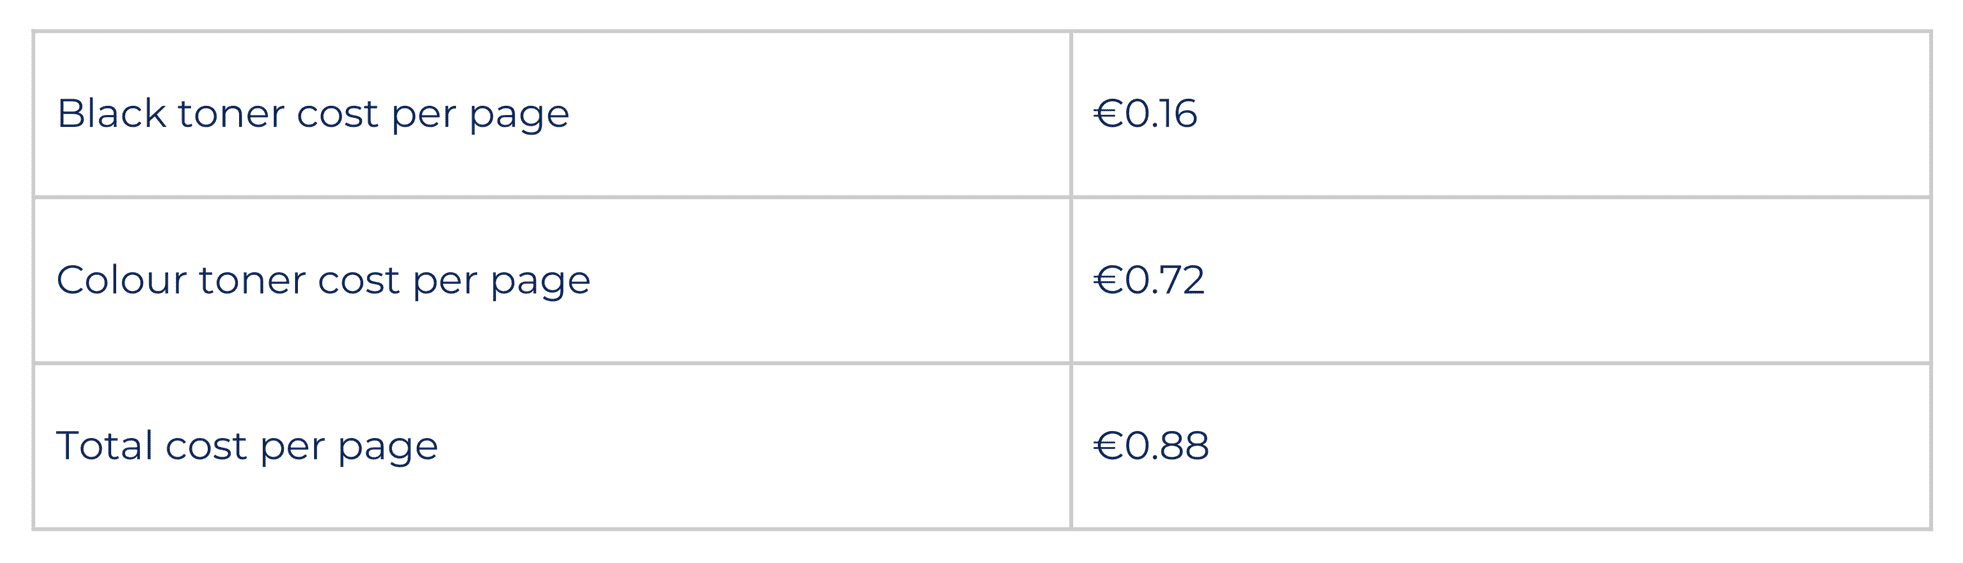
At 300 pages per month, this equates to approximately €264 in monthly print spend, or more than €3,000 per year, from a single rather modest device.
Why these costs often go unnoticed
Hopefully, by now it will be clear to readers just how easy it is for organisations to get caught off guard by rising print costs when consumables are purchased transactionally. Print environments tend to evolve quietly. Document formats change. Branding becomes more complex. Colour usage increases. Hybrid working and scanning alter workflows. Yet the underlying print model remains the same.
Because the environment still functions, there is rarely a clear trigger to revisit how costs are calculated. Over time, variability becomes normalised, and budgets absorb the impact without anyone seeing the mechanics behind it.
This is why print costs often feel unpredictable, and why transactional purchasing models struggle to provide meaningful control once document complexity increases.
How managed print services compare in practice
At this point, we have seen how page coverage drives transactional print costs higher than most organisations expect. The natural next question is how those same documents behave under a managed print services model.
To illustrate this difference, it helps to compare both approaches using the same realistic print volume:
- 300 colour pages per month
- A typical mix of everyday office documents
- Average document coverage of approximately 20%
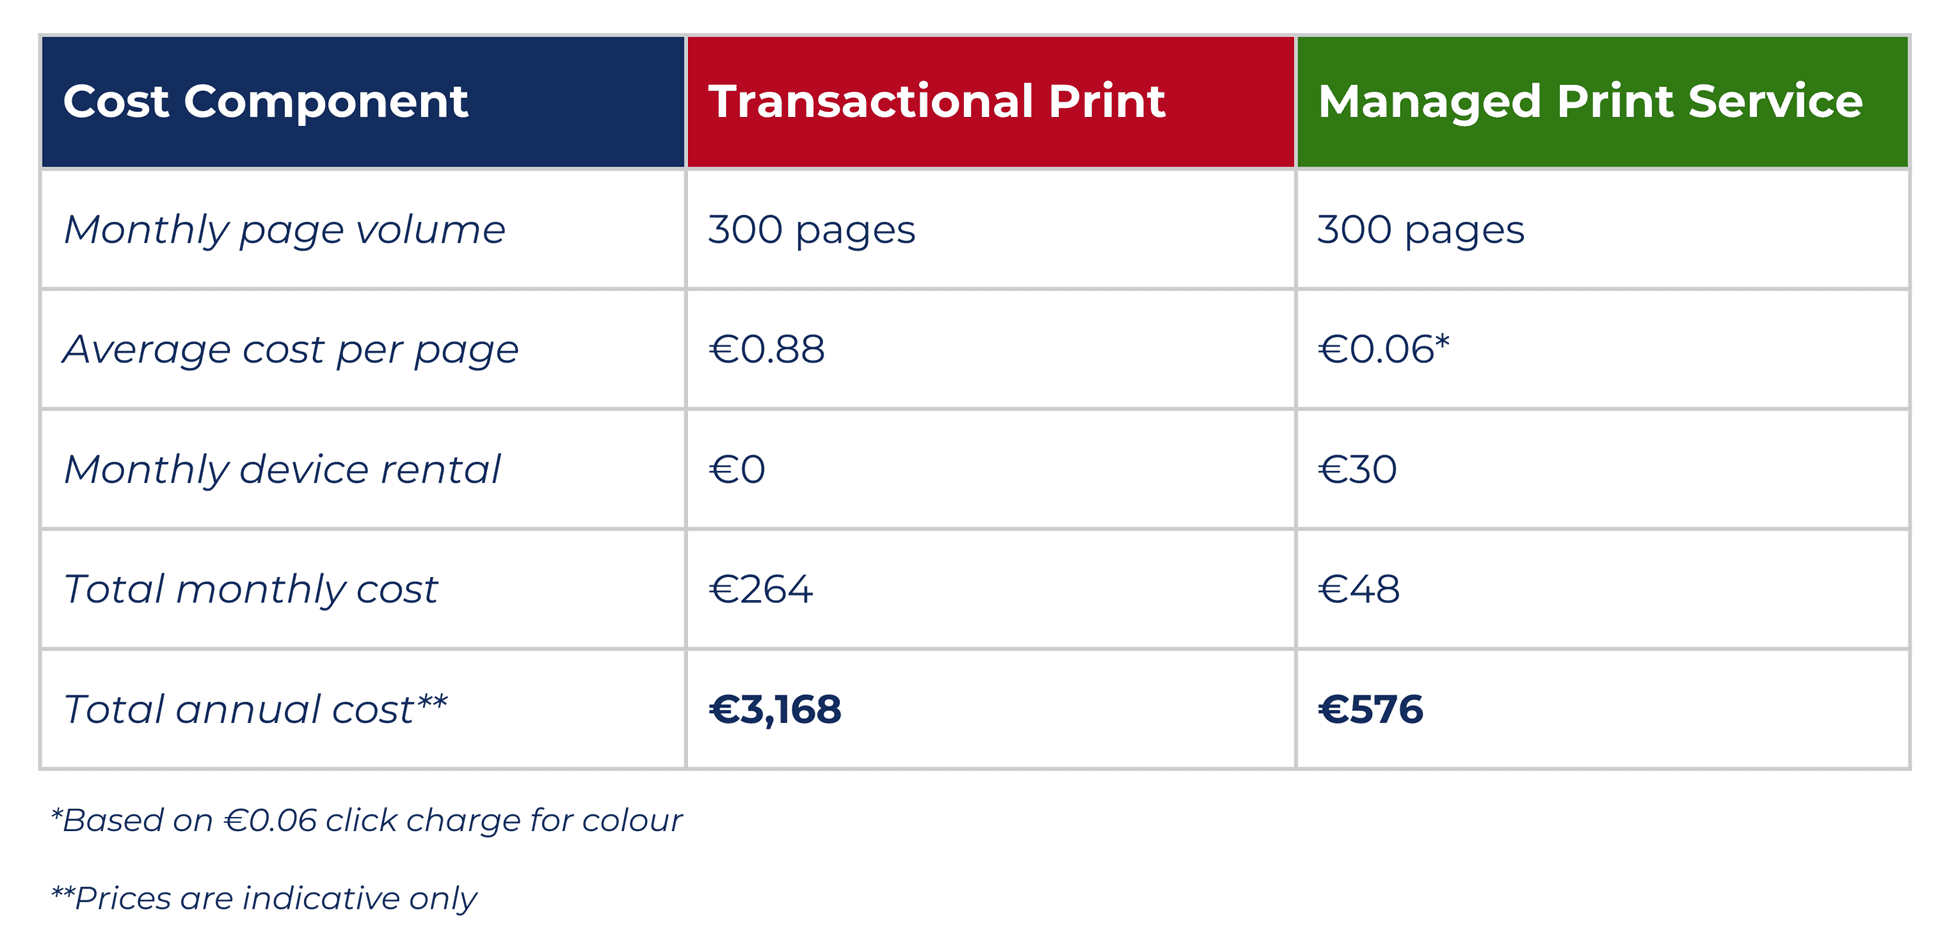
We can see that even at relatively low print volumes of just 300 pages per month, the transactional model is more than fives times as expensive. This is because, when you move to a managed print model, coverage percentage no longer affects cost. Whether a page contains a short email or a full-page table, the pricing outcome remains the same.
Next step
If this article has resonated with you and you’re interested in getting an objective view of your print environment to uncover cost saving opportunities, a short print audit will provide you with the insight you need, with no obligation to change anything. Please feel free to leave your details below and one of our print specialists will be in touch.